
Expected goals (xG) is a topic that has caused heavy debate amongst Australian football fans in recent weeks, as it has become an increasing part of Paramount Plus’ A-Leagues coverage.
Fans have had mixed opinions on the use of it during matches, with some liking its introduction, some preferring it to just be spoken about after matches and others not wanting to hear it at all.
Sparked by a debate unintentionally caused by the author on Twitter, and using data and explanations from Opta Analyst, FbRef and Fotmob, this article is a depiction of what xG is, why it’s important and its misconceptions in football.
What is xG?
Expected goals, also called xG is, according to Opta, is a statistical device that “measures the quality of a chance by calculating the likelihood that it will be scored from a particular position on the pitch during a particular phase of play. This value is based on several factors from before the shot was taken.”
It’s calculated on a value from zero to one, and is modelled on thousands of previous situations, therefore accounting for luck and misfortune, like if the attacker slips before taking a shot. It also takes into account the pass received, opponents around, positioning and where the ball is in relation to the goal.
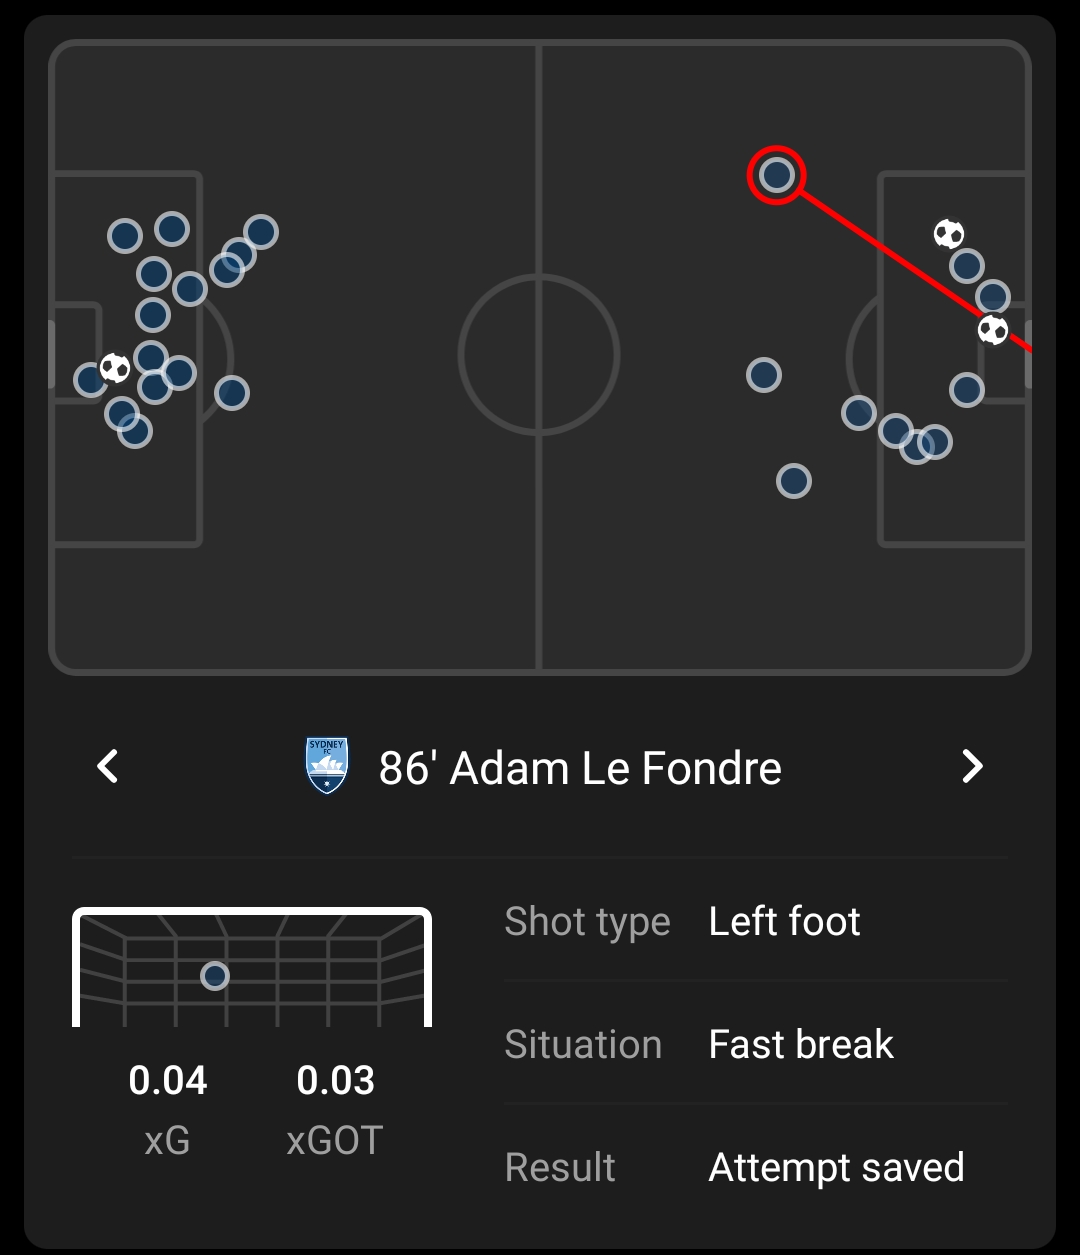
If a shot is taken from far out, it has a significantly low chance of being a goal, particularly when the ball carrier is rushed and the goalkeeper is in a decent to good position. Adam Le Fondre’s attempted chipped shot, taken last night against Adelaide United, had an xG of 0.04.
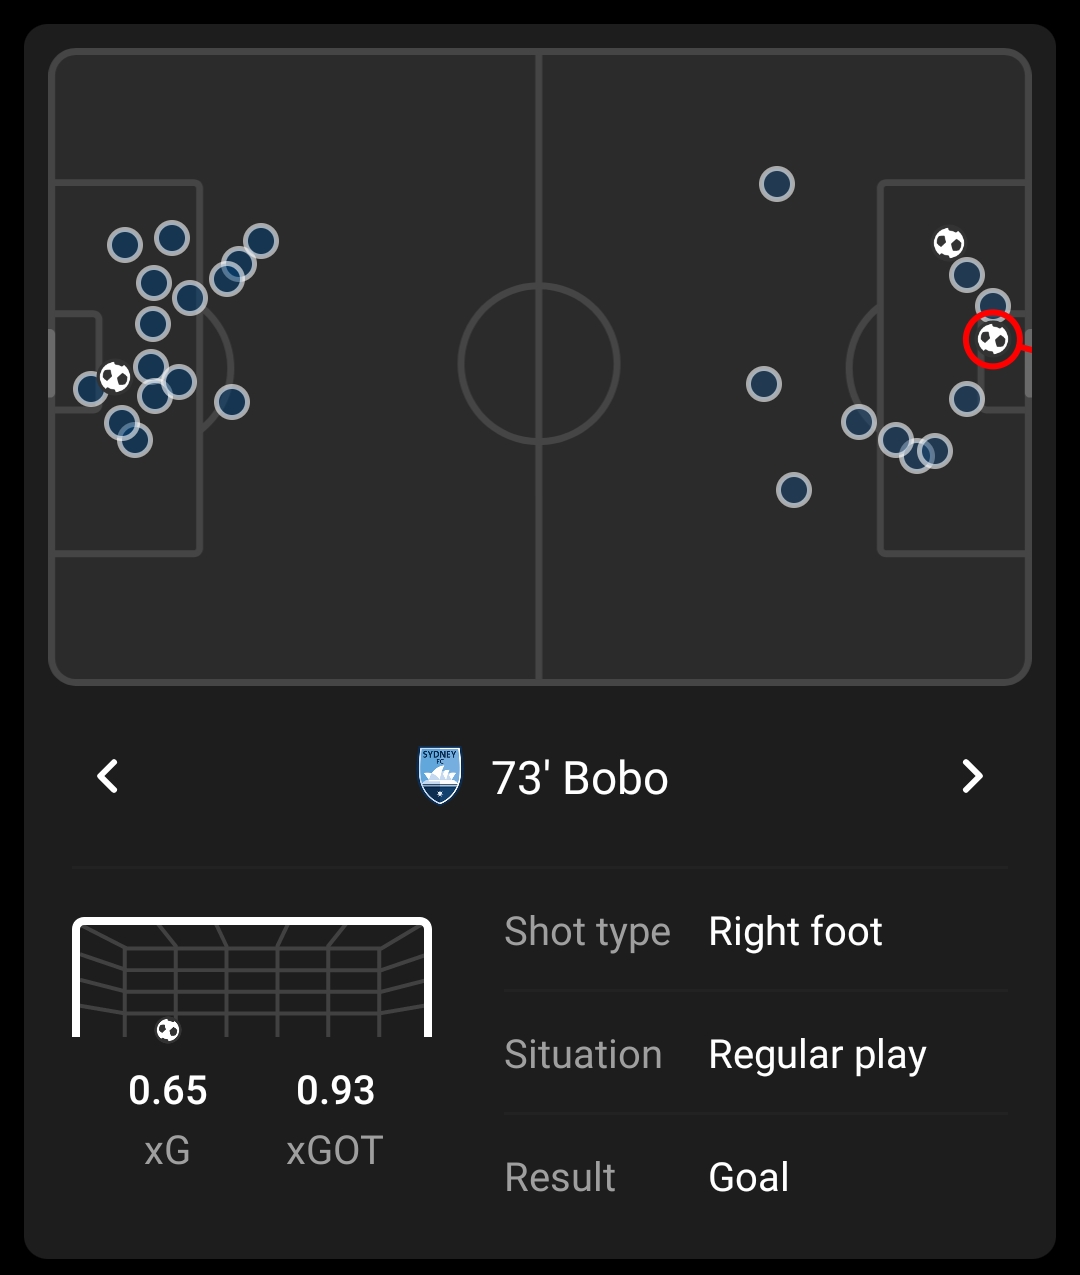
Meanwhile, Bobo’s goal and match-winner, which was a tap in where he ran towards the goal in an advantageous position to receive a cutback from Max Burgess, had a high xG of 0.65, due to it essentially being a tap in/one-touch finish from close range.
Different uses of xG
xG can be used in many different formats, like a cumulative xG graph which depicts the value of chances throughout a game and shows the game state, and the dominance of chance creation and attack during a game.
xG per shot shows a team or individual’s expected goals value for every shot they take, by dividing their xG over a given period by their number of shots in that same period.
An xG shot map also shows the chance value of every shot, and can be found on a free app like FotMob.
But crucially, xG is most useful over a sustained period of time, where looking at things like expected goal difference (xGD) can indicate the performance of a side.
Why is it important?
xG is important because it allows coaches and teams to look at their chance creation in objective, statistical values to show the efficiency of their build-up and system in possession.
It crucially also shows your expected goals conceded (xGA), which over time provides an indication of how your team is performing, based on xGD. xGA over time can show the quality of a defence.
It also can provide guidance* to which side deserved to win a match, which can be helpful if you haven’t watched a game but want a basic understanding of the events. However, an xG shot map is also useful for this, and it’s more for raging disparity, like if side A loses 1-0 despite side A having an xG of 1.9 and side B having an xG of 0.2.
It shows over time the shooting ability of a player, while it can assess their abilities off set pieces to generate chances, and more in-depth statistical analysis can look at key areas where opponents create their chances, which can help provide a side with tactical game plans to stop them.
*Crucially, it provides guidance, not what should have happened. It can be from a combination of luck and skill, while other measures like xG per shot, xG plots, big chances created, expected threat and your eye test would be required to show which side truly deserves to win a match.
Common misconceptions
Expected goals are not based on luck. It is based on the execution of decision making and technique in high-pressure environments.
The team that has the higher xG in a match should win – again it comes back to quality not luck and highly depends on game state and the frequency of high-quality chances. For example, if team A has an xG of 0.9 and team B has an xG of 1.2, people may assume that team B deserves the win. However, if team A scored 2 goals which each had an xG of 0.4 and team B didn’t have a shot with an xG of above 0.15, it makes it harder to differentiate. While one argument can be that the accumulation of shots from team B results in what should be a win, others would suggest that team A’s quality of chances suggests they deserved the win, hence xG per shot being such a crucial measure.
Sample size. Once again, random events can transpire over a short basis. It’s important to elongate the sample size to gain a better understanding of a sides attacking play over time.
xG only measures shots, not chances created (this is true not a misconception). If a player is in a good position to shoot but makes a poor decision and moves into a lesser quality position, the xG lowers due to the measurement only being from the shot taking place. Alternatively, a shot could not be taken which isn’t measured by xG.
Why xG isn’t based on luck
Brighton and Hove Albion have been a side that has helped further the influence of xG for mainstream football fans through their extreme underperformance of goals compared to what was expected.
They have struggled to find a clinical finisher within their side, which has resulted in a consistent underperformance of their xG – last season they underperformed by almost 12 goals and this season by just over 4.
This shouldn’t be put down to simply being unlucky, as a higher quality finisher or goalscorer will consistently overperform the chances they receive. Again, this isn’t classified as luck, but rather by a poorer or better execution of the chances they find themselves in, based on the quality of the player.
For example, last season, Messi scored 30 goals from an xG of 23.94. This isn’t Messi being lucky in his goalscoring, but his quality, technique and finishing ability shining through. Prior to this campaign which can be classified as somewhat of an outlier, Messi has consistently overperformed his xG substantially, which again is due to his consistent quality rather than luck. Teams will pay bigger money for players who can, and have, overperformed their xG on a consistent basis because they are less likely to regress to the mean.
The next step for Australian football becomes looking at xG over a longer, sustained period of time. xGD will give a key insight into a teams relative over or underperformance compared to their chances created and given, and from there, studies can be taken to look into those reasons, and how much relates to the quality of players as opposed to luck, which will depreciate with a larger sample size.
But one thing’s for sure – xG is only going to increase in its stature within mainstream analysis, broadcasting and media in Australian football.